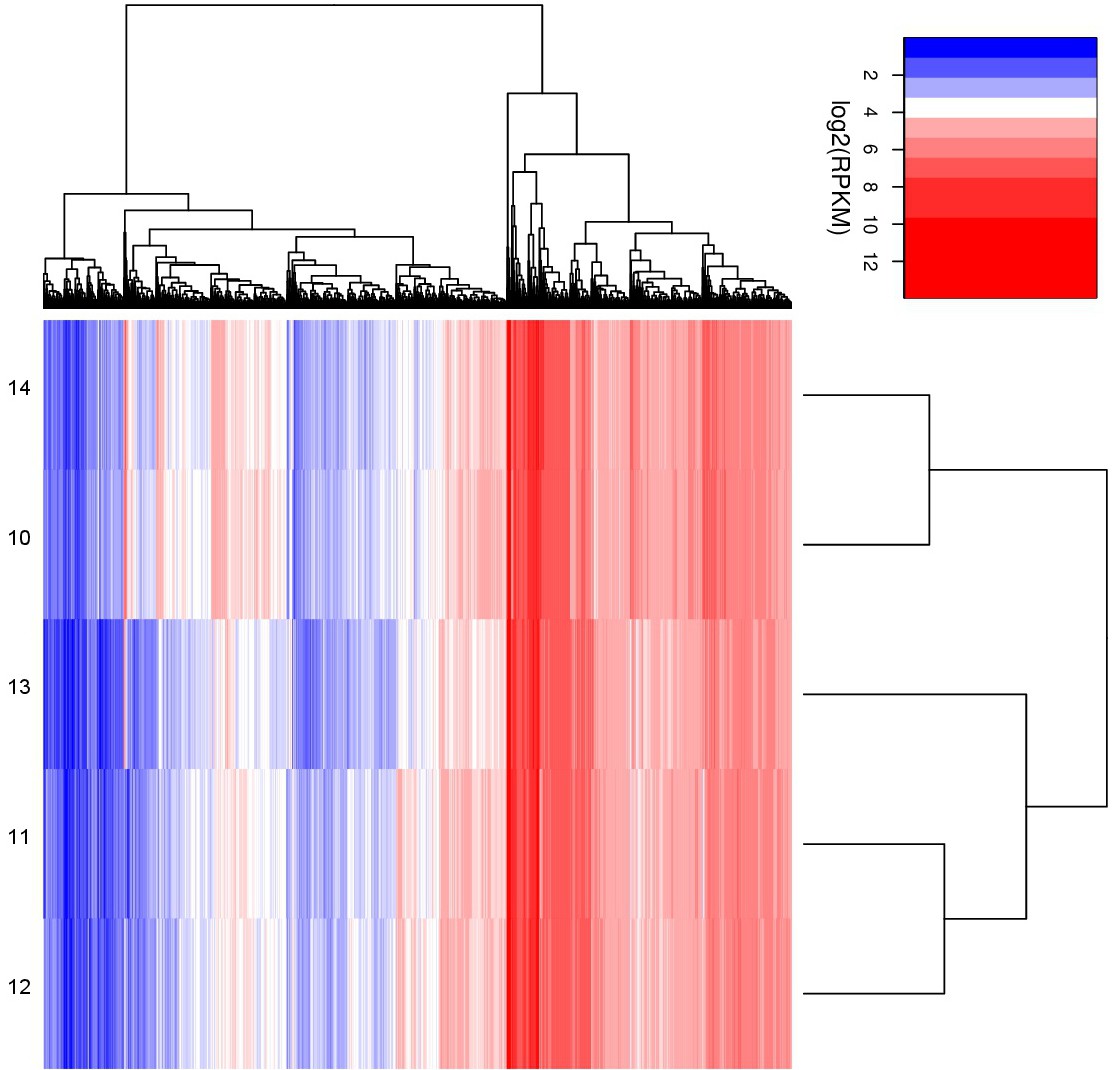
Fig. 5. Heatmap cluster analysis of mRNA-Seq results for sclerodermiform basal cell carcinoma samples 10 to 14. The color scale reflects the log2 signal intensity and runs from blue (low intensity) to white (medium intensity) to red (strong intensity).